


We’re taking a close look at Emgold Mining, a Vancouver-based exploration and mine development company with properties in Quebec, Nevada and British Columbia.
With so many mining companies competing for our attention, what is it about Emgold that has us interested? Three key factors, the current stock price, the broad range of assets they own – we’re big fans of the ‘don’t keep all your eggs in one basket’ approach, and their management.
Summary of their key assets:
A 3.75 million share holding (approx. 5.5% ownership equivalent) in Troilus Gold Corp (TSX: TLG). Troilus is an emerging gold producer focussed in Quebec. (Emgold’s percentage ownership stake fully reflects a C$12 million bought deal public stock offering announced by Troilus Gold on April 10, 2019. The offering, which significantly strengthens Troilus Gold’s financial position, should close in early May 2019.)
The right to acquire up to 91% interest in the Casa South Property in Quebec, a property located just south of Hecla Mining Company’s Casa Berardi Mine. Casa Berardi has produced nearly two million ounces of gold since 1988.
A 100%-owned stake in the Golden Arrow project in mining-friendly Nevada, an advanced stage gold and silver property.
A 100% stake in the Buckskin Rawhide East Property (BRE) in Nevada. Emgold has leased BRE to Rawhide Mining LLC which owns the nearby Rawhide Mine, eliminating any future operating or carrying costs. Under the lease agreement, Emgold is likely to receive at least US$15 per ounce of any gold mined from BRE.
We’ll look at each of these assets in more depth, but before we do, a quick word on their management. Emgold is led by CEO David Watkinson, an industry veteran with 30 years experience in underground and open pit mine development. We consider the management team to be very shareholder-friendly, as evidenced by three transactions in late 2018: the tactical and well-priced sale of the Troilus North property to Troilus Gold Corp. and the strategic acquisitions of the high-potential stakes in Golden Arrow and Casa South properties.
Casa South Property:
In December 2018, Emgold reached an agreement with two different vendors, as well as the finder, of Casa South to acquire a 91% interest in the 10,000 hectare property located immediately south of the Casa Berardi mine. (A hectare is 10,000 square meters.) Casa Berardi produced nearly 163,000 ounces of gold in 2018 and has 1.91 million ounces of remaining gold resources.
In March 2019, Emgold began a 10-hole, cumulative 3000-meter diamond drilling program in the Kama trend area of Casa South. See Figure 1. Five holes have been drilled so far. The program should be completed by the end of April 2019, and assay results should begin to be released in early May 2019.
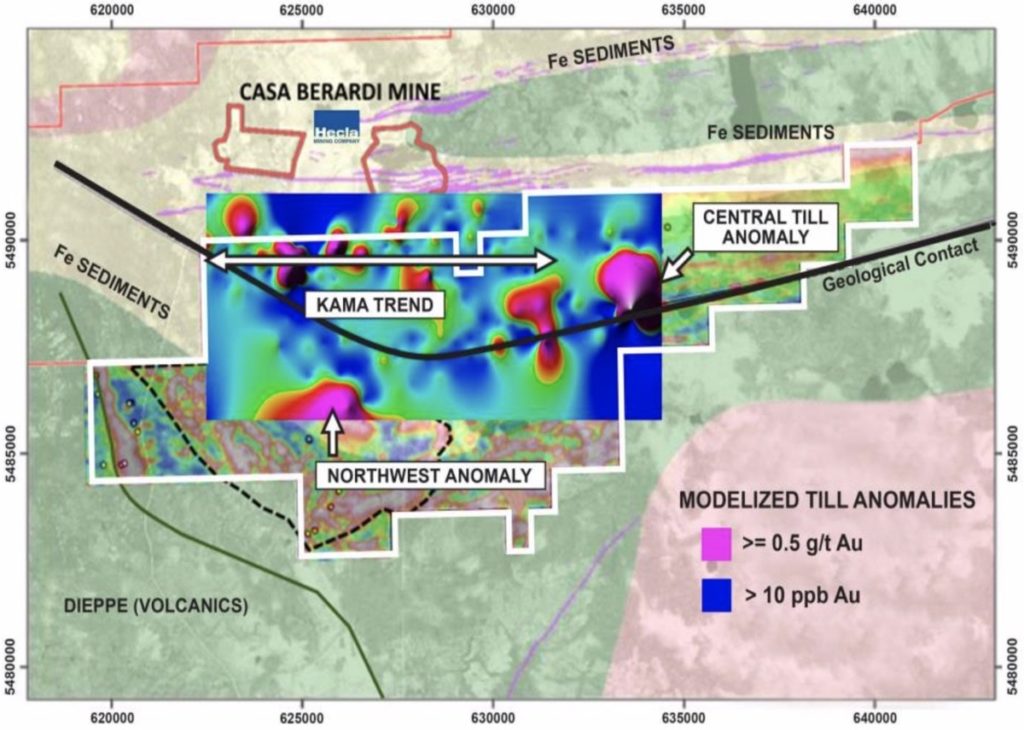
Source: Emgold Mining Corp.
If Emgold’s drilling program ultimately were to lead to a substantial discovery, a natural potential acquirer of the Casa South property is the owner of Casa Berardi, Hecla Mining. A side note and an illustration of the importance of Casa Berardi to Hecla: on April 1, 2019, Hecla updated its mineral resources estimate. In that report, Casa Berardi’s proven and probable reserves were judged to have increased 28% to around 1.91 million ounces of gold. Casa Berardi comprises fully 35% of Hecla’s revenues.
Golden Arrow Property
Emgold acquired a 100% interest in the 7,000-acre Golden Arrow Property from Nevada Sunrise Gold Corp. (TSXV: NEV) in October 2018 in exchange for C$100,000 in cash and five million Emgold shares (issued at a deemed share price of C$0.135), equivalent to a combined total value of around C$775,000.
In a September 2018 report, Mine Development Associates estimated that Golden Arrow contained measured and indicated (M&I) mineral resources of 296,500 ounces of gold and 4.0 million ounces of silver, equivalent to a total of 343,000 gold-equivalent ounces (based on US$1,300 and US$15 per ounce gold and silver prices, respectively).
A key positive for Golden Arrow is its location: along the northeastern margin of the Walker Lane structural zone in Nevada, a trend well known for bulk disseminated gold deposits. Numerous mines in the region have produced substantial quantities of precious metals, as well as boasting high levels of resources. For example, Kinross Gold Corp.’s (NYSE: KGC) Round Mountain mine produced more than 400,000 ounces of gold equivalent in 2017. Round Mountain’s current reserves plus past production total nearly 30 million ounces of gold equivalent. See Figure 2 for the names of other large precious metal mines in the Walker Lane trend, as well as Golden Arrow’s location relative to these mines.

Source: Emgold Mining Corp
Of significant note is that Coeur Mining paid US$90 million late last year to acquire Northern Empire Resources, equivalent to a takeover price of US$117 per ounce of gold. Emgold is valued at around US$8 per ounce of gold equivalent resources (when we adjust for its ownership stake in Troilus Gold Corporation and Troilus’ mineral resources). Northern Empire Resources’ principal asset was the Sterling gold project and its large prospective land package in the Walker region. Sterling could become one of the highest-grade heap leach mines in the western U.S.
Based on drilling records collected by seven companies over the past 20 years, gold and silver exist both in high-grade vein-hosted mineralization and in more widespread and disseminated depositions in the Gold Coin and Hidden Hill zones of the Golden Arrow Property. Golden Arrow has a completed Plan of Operations and Environmental Assessment that allows for a major drilling program to commence – most likely in the second half of 2019. The company’s near-term exploration focus is the Casa South Property.
Source: Emgold Mining Corp.
It is instructive to compare the Golden Arrow Property to Northern Vertex Mining Corp.’s Moss Gold-Silver Mine in northwestern Arizona. The Moss mine began commercial production in September 2018. Northern Vertex expects the open-pit mine to produce 36,000-40,000 gold-equivalent ounces in the year ending June 30, 2019. Such a production level could imply operating cash flow at the mine of US$10 million or more. Importantly, the Golden Arrow Property bears strong similarities to the Moss Mine both in terms of the size of the mineral resources and gold and silver grade. See the table below for further detail:

Buckskin Rawhide East (BRE) Property
BRE is an 835-acre property in the northeastern portion of the Walker Lane region. The property abuts and has similar geology and mineralization as Rawhide Mining LLC’s Denton-Rawhide Mine, a mine which produced 1.7 million ounces of gold and 14 million ounces of silver over a 25-year period ending in 2014. Rawhide Mining is a private company; its production averaged 22,700 ounces of gold over the 2012-2017 period.
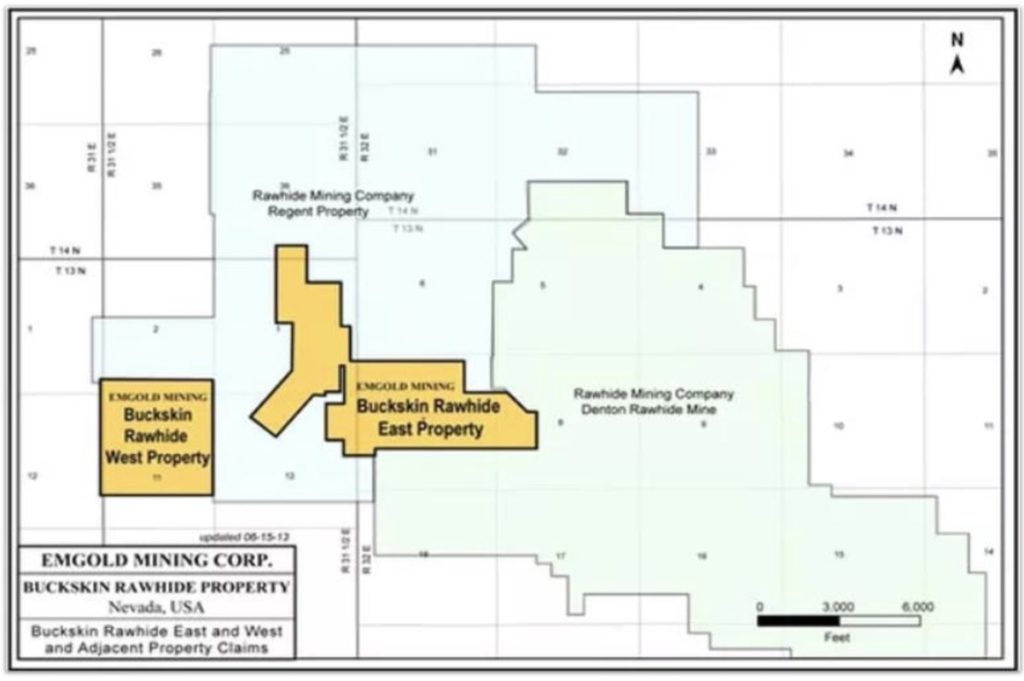
Source: Emgold Mining Corp.
Effective June 1, 2013, Emgold leased BRE to Rawhide Mining for a 20-year term under which Rawhide Mining makes advance royalty payments to Emgold of C$10,000 each year. As background, Rawhide Mining made total private placement investments into Emgold of C$1 million over the period 2012-2014 (C$465,000, C$285,000 and C$250,000 in 2012, 2013, and 2014, respectively). Emgold utilized a portion of these investments to buy out underlying claim owners of BRE.
Rawhide Mining just completed a new Plan of Operations (POO) and Environmental Assessment (EA) to mine the Regent deposit adjacent to both the Denton-Rawhide Mine and BRE. The POO and EA allow for a major exploration program to be conducted on the property, which is likely to commence in late 2019 or 2020. Exploration success on the property would translate into long-term, risk-free benefits for Emgold.
Investment in Troilus Gold
In December 2018, Emgold sold its Troilus North Property to Troilus Gold Corp. for C$250,000 in cash and 3.75 million Troilus Gold shares. Troilus North has no measured mineral resources. The sale of the Troilus North Property (11,300 hectares) to Troilus Gold tripled Troilus’ total land position to 16,000 hectares.

Source: Troilus Gold Corp. April 2019 investor presentation, “Advancing Quebec’s Next Gold Producer.”
The Troilus Mine was an open pit and underground mine operated by the Inmet Corp. which produced two million ounces of gold and 70,000 tonnes of copper over the period 1996-2010. The Troilus property is in general a thick and continuous low-grade ore body with mineralized zones about 50 meters wide. Given the low price of gold over much of the 1996-2010 period – gold was priced below US$500 per ounce over the first ten years of that period – Inmet explored very little outside of the main ore body or below the original resource shell. The property has substantial infrastructure already built, including a 50-megawatt electric substation, a 65-kilometer dedicated power line, a fully-permitted tailings facility, and many roads.
In 2018, Troilus Gold Corp. initiated a 91-hole, 36,000-meter drilling program to demonstrate and expand the mineral resource potential of its Troilus gold and copper property. The program was focused on the underground potential at the Z87 zone and open pit mining possibilities in the J4 and J5 zones. The Z87 zone has been the source of most of the Troilus Mine’s past production. The J4 zone included a past-producing open pit mine; the J5 zone housed a shallow, open-pit mine that produced just 50,000 tonnes of mineralized resource around 2010. Troilus Gold Corp. geologists believe the J4, J5 and Z87 zones are connected ore masses. Perhaps equally important, the J4 and J5 zones remain open at depth and along strike.

Source: Troilus Gold Corp. April 2019 investor presentation, “Advancing Quebec’s Next Gold Producer.”
In November 2018, Troilus Gold released a new mineral resource estimate for the Troilus gold and copper property based on the results of the 36,000-meter drilling program. Troilus now estimates the property contains 3.92 million and 1.17 million gold-equivalent ounces on indicated and inferred bases, respectively. See Figure 7. This 5.09 million ounce total represents a 90% increase from the previous November 2016 estimate. (Importantly, the 5.09 million ounce resource estimate does not include any resources at the Troilus North property acquired from Emgold.) The increase in Troilus Gold’s mineral resources in 2018, when factored against the costs of the 2018 drilling program, equated to a 2018 discovery costs of less than US$3.00 per ounce of gold equivalent.

Source: Troilus Gold Corp. April 2019 investor presentation, “Advancing Quebec’s Next Gold Producer.”
In the first quarter of 2019, TLG initiated a further 40,000 meters of diamond drilling. About 60% will be devoted to the J4 and J5 zones and the balance to Z87. A key goal of the program is to prove the mineralized J zones extend to the northeast and into the Troilus North region. Indeed, a magnetic low trend — which signifies variations in the chemistry or magnetism of the rocks, a constructive sign for the presence of precious metals — extends well into Troilus North.

Source: Troilus Gold Corp. April 2019 investor presentation, “Advancing Quebec’s Next Gold Producer.”
In late March 2019, Troilus Gold announced that one of the first holes drilled in this program, in J4-J5 zone, encountered gold-rich mineralization 300 meters from the surface, including a grade of 1.11 grams per tonne of gold-equivalent over a 19-meter length. This positive result was generally within the range of expectations, but another facet of this hole was even more noteworthy: just beyond the expected end of the mineralization, a new mineralized zone was encountered which is open in all directions. Troilus Gold is drilling additional holes in that area to assess the potential extent of this new zone discovery.

Source: Troilus Gold Corp. March 26, 2019 press release, “Troilus Discovers New Gold Zone in a Southwest Footwall of J Zone – Hole Terminated in Open Mineralization.”
In light of the first drilling results announced in March, we expect Troilus Gold to issue a number of constructive news releases over the 12-15 months: further exploration results from its drilling program will be announced throughout 2019; a preliminary economic assessment (PEA) is likely to be released sometime in the third quarter of 2019; and a pre feasibility study (PFS) should be issued around the second quarter of 2020.
Emgold’s Valuation Relative to Similar Junior Miners:
In the following, the valuations of a group of developmental-stage junior gold mining companies are compared to Emgold.
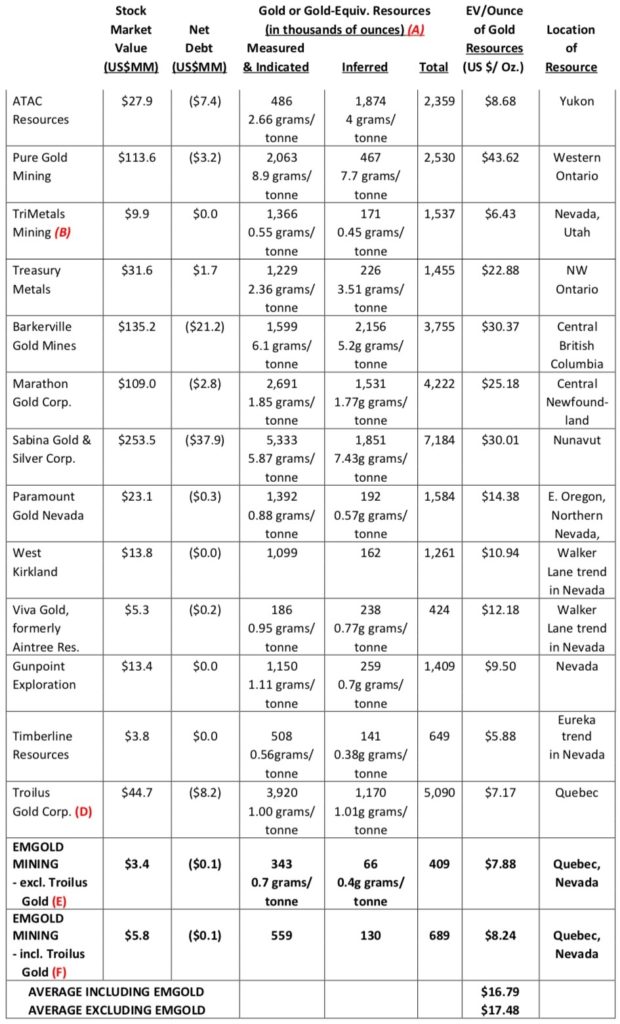
(A) If available, gold mineralization rates, expressed in terms of grams of gold per tonne mined, are shown for each company.
(B) Data for Tri Metals Mining includes gold and silver resources.
(D) Gold resources are calculated using long-term metal prices of US$1,400 per ounce gold and
US$3.25 per pound copper. US$1.00 = C$1.25 exchange rate.
(E) Emgold’s valuation is calculated EXCLUDING the value of its holdings in Troilus Gold Corp. and includes only the mineral resources of the Golden Arrow Property and EXCLUDES any mineral resources from the Casa South Property or any mineral resources from Buckskin Rawhide East.
(F) Emgold’s valuation is calculated INCLUDING the value of its holdings in Troilus Gold Corp. and includes only the mineral resources of the Golden Arrow Property and EXCLUDES any mineral resources from the Casa South Property or any mineral resources from Buckskin Rawhide East.
Key observations on the data displayed in the above table:
• The Emgold valuation is expressed here in two separate waysin two different ways. First, showing Emgold’s valuation net of its investment in Troilus Gold Corp. by subtracting the value of Emgold’s 3.75-million share (approximately 5.5% stake) investment in Troilus Gold from Emgold’s enterprise value and comparing it to the mineral resources of its Golden Arrow Property only. In this calculation, no mineral resources are ascribed to Casa South, nor is any value accorded to the BRE Property. Even using this conservative approach, Emgold shares trades at a sharp discount to those of its peers.
Second, listing Emgold’s valuation including its Troilus Corp. investment by comparing Emgold’s full enterprise value to the total of its Golden Arrow’s mineral resources plus 5.5% of Troilus Gold’s mineral resources. Under this methodology, Emgold shares are similarly shown to be very cheap versus its junior mining peers. (In this conservative calculation, no value is again accorded to either Casa South or BRE.)
• If Emgold were to trade at the average EV-per-ounce of gold equivalent resources of its junior mining peers, the stock would trade at around C$0.40 per share, or more than double current levels. Note also that if one were to impute any mineral resources to Emgold’s Casa South Property, the implied fair value of Emgold shares would be even higher.
• Analyzing the data from Table 1, the conclusion is that Troilus Gold Corp. is undervalued, as its EV/ounce of gold-equivalent resource is only about US$7.15. If Troilus shares were to appreciate to a still-reasonable price of C$2.00 from its current C$0.86 level, that would by itself imply about a 50% increase in Emgold’s share price.
Source: Jim McFadden, CFA, MBA Tormont50 Research
Too find out more about Emgold Mining visit their website.


